The BlazeMeter API Monitoring alternative without the enterprise platform
BlazeMeter API Monitoring is what Runscope became — multi-step API tests with assertions, run from several locations, inside Perforce's broader performance testing platform. Powerful, and sold as enterprise tooling.
From $5 a month · No check quotas · Set up in under a minute
Is MonitoringDaddy a real BlazeMeter API Monitoring alternative?
For continuous availability checks on endpoints without adopting an enterprise testing platform, yes. BlazeMeter is better if you need multi-step API workflows, shared environment variables or load testing alongside monitoring.
Why people look for a BlazeMeter API Monitoring alternative
Enterprise platform for a few endpoints
You are buying performance testing infrastructure to check that an API responds.
Multi-step tests may be more than you need
Chained requests with variable extraction are powerful and often unnecessary.
No certificate, domain or content monitoring
All three matter for the sites around your API.
BlazeMeter API Monitoring vs MonitoringDaddy
Green marks the stronger option on that row. Third-party pricing and limits change without notice — treat the BlazeMeter API Monitoring column as a starting point and confirm current figures on their site before you decide.
| Feature | BlazeMeter API Monitoring | MonitoringDaddy |
|---|---|---|
| Multi-step API test chains | Yes — with variable extraction | Status, keyword conditions, custom headers, methods and basic auth |
| Load and performance testing | Yes | No |
| Multi-location execution | Yes | One origin |
| Uptime monitoring | Yes | Yes, with incidents |
| SSL and domain expiry | Partial | Yes — attached to any monitor, no extra allowance |
| Website change detection | No | Yes, with word-level diffs |
| Cron / heartbeat monitoring | No | Yes — up to 100 on Pro |
| Entry paid price | Enterprise — verify on their site | $5/mo for 25 monitors, 25 watches, 25 heartbeats |
What BlazeMeter API Monitoring does better
Every comparison page on the internet claims the author's product wins on everything. Here is where it does not.
- Multi-step API workflows with variable extraction between requests.
- Load testing in the same platform as monitoring.
- Execution from multiple locations with enterprise reporting.
If any of those are load-bearing for your team, staying put is the correct decision and this page has done its job. Monitoring you actually trust beats monitoring that is marginally cheaper.
What you actually get with MonitoringDaddy
Six monitor types and one dashboard. No add-on products, no separate SKUs for the features you assumed were included.
Uptime monitoring
HTTP checks from external infrastructure, as often as every 60 seconds, with downtime and recovery alerts. See the uptime setup guide.
SSL certificate expiry
A dedicated monitor type with configurable advance warnings, so a certificate never lapses because nobody owned the renewal. See SSL expiry monitoring.
Domain expiry
Registration expiry tracked as its own monitor, warning you months ahead. The outage nobody has a runbook for. See domain expiration monitoring.
Content change detection
Alert when a phrase appears or disappears on a page — defacement, stock changes, silent policy edits. See website change detection.
Price monitoring
Watch a competitor or supplier price string and get told the moment it moves. See the price monitoring guide.
Hosted status pages
Public status pages included on every plan, hosted independently of your infrastructure so they stay up when you do not. See hosted status pages.
Alerts from any of these can be routed to email, Slack, Microsoft Teams, Discord, Telegram, Flock or a generic webhook, and a single monitor can carry several channels at once. Everything is available through the REST API on paid plans, so monitors can be created and torn down programmatically rather than clicked through a form.
Who should switch — and who should stay
Switch if…
- You have a handful of endpoints and no need for load testing.
- You want certificate, domain, cron or page monitoring.
- Enterprise pricing is out of proportion.
Stay on BlazeMeter API Monitoring if…
- You need chained multi-step API tests.
- Load testing is part of your work.
- Multi-location execution matters.
What MonitoringDaddy costs
Flat monthly tiers. No per-seat charges, no credit top-ups, no usage meters — the number below is the whole bill. There is no free plan; every tier can be cancelled at any time.
| Plan | Monitors | Fastest interval | Alert channels | API | Price |
|---|---|---|---|---|---|
| Starter | 25 | Every 5 minutes | Email + webhook & chat | Yes | $5/mo |
| Basic | 10 | Every 10 minutes | Email + webhook & chat | Yes | $8/mo |
| Growth | 50 | Every 5 minutes | Email + webhook & chat | Yes | $19/mo |
| Pro | 100 | Every 60 seconds | Email + webhook & chat | Yes | $34/mo |
Annual billing is cheaper on every paid tier. The pricing page is the authoritative list.
Moving from BlazeMeter API Monitoring without a gap in coverage
There is no automated importer — monitors are re-created by hand, or scripted through the API. Budget about a minute per monitor. These are the real screens.
1. List what you actually monitor
Export or write down every active check in BlazeMeter API Monitoring: the URL, how often it runs, what counts as a failure and who gets alerted. Most teams find checks nobody needs any more — this is the moment to drop them.
2. Re-create the important ones first
Open Monitors → API → New API monitor. Under Request, set the method, headers and authentication you used in BlazeMeter API Monitoring, and use a text check on the response body. There is no request-body field, so point it at a GET health endpoint.
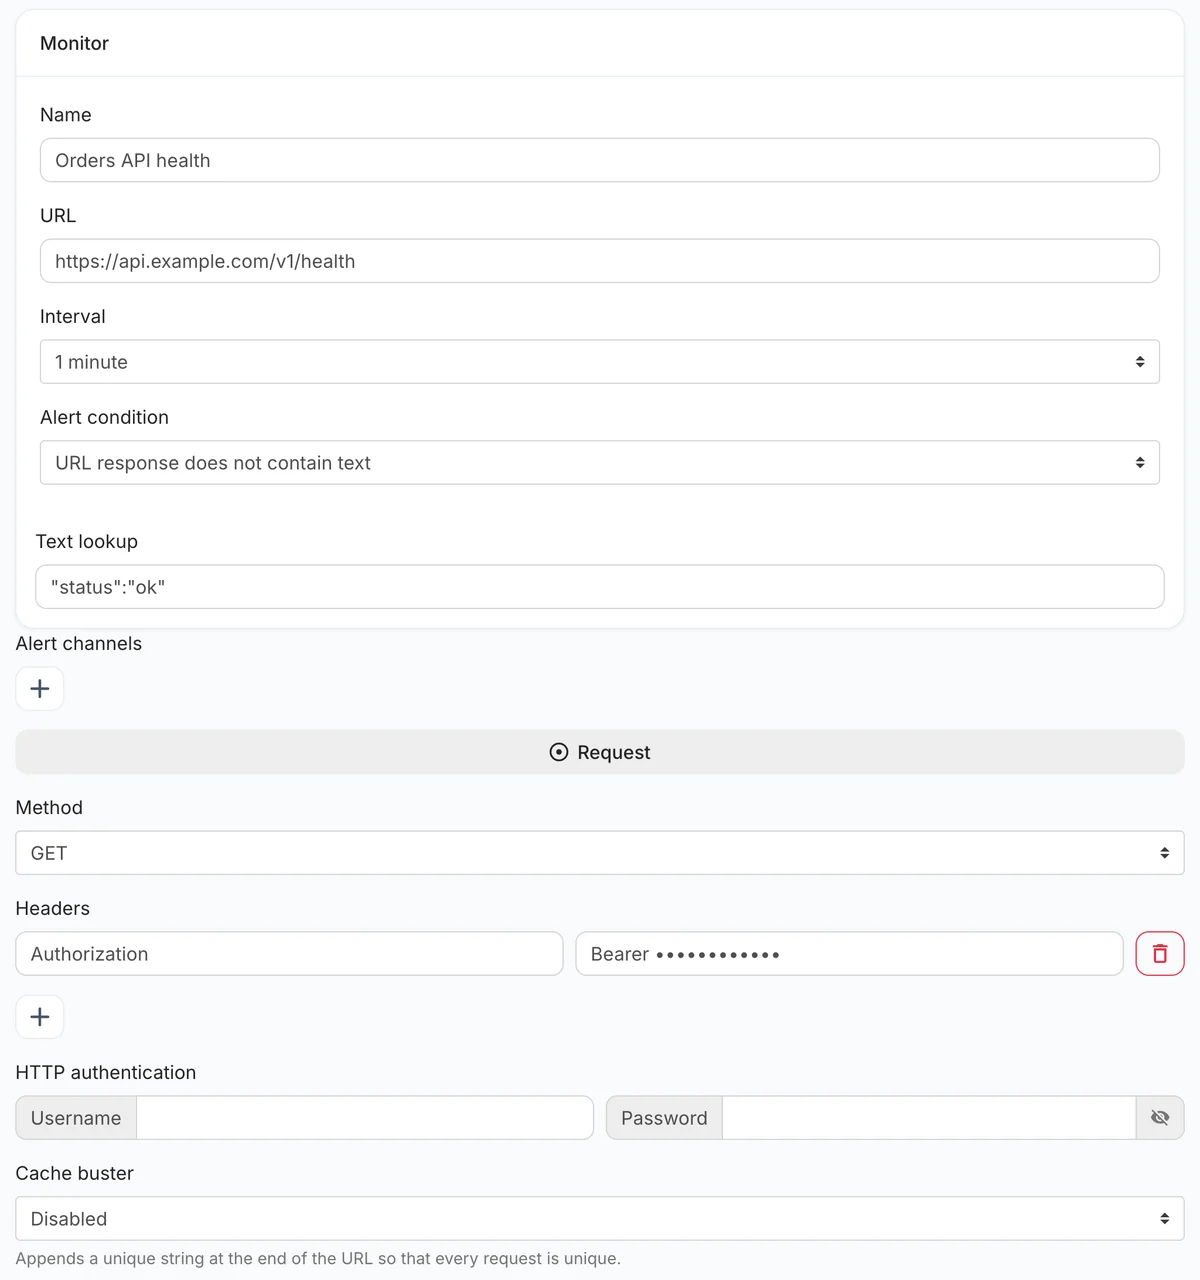 Method, headers, authentication and a text check.
Then click + under Alert channels and add the same destinations your team watches today — email, Slack, Microsoft Teams, Discord, Flock, Telegram or a webhook.
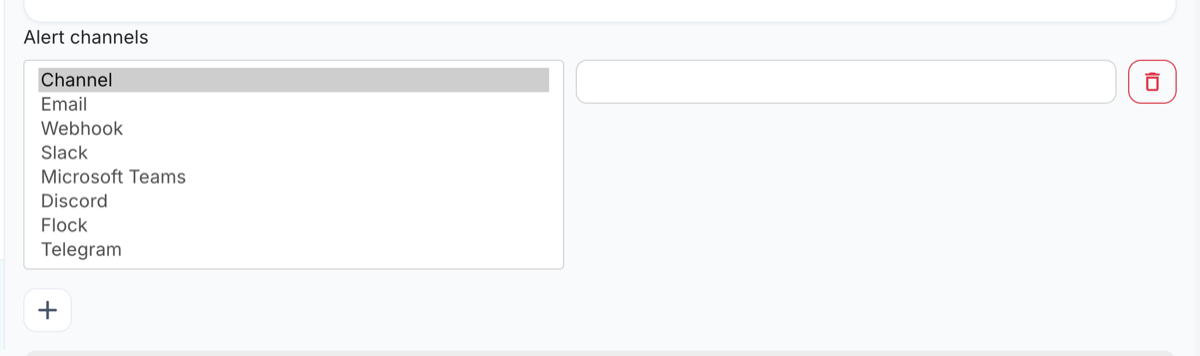 Alert channels available on every monitor.
3. Run both tools in parallel for a week
The overview charts response time and lists each check's status code.
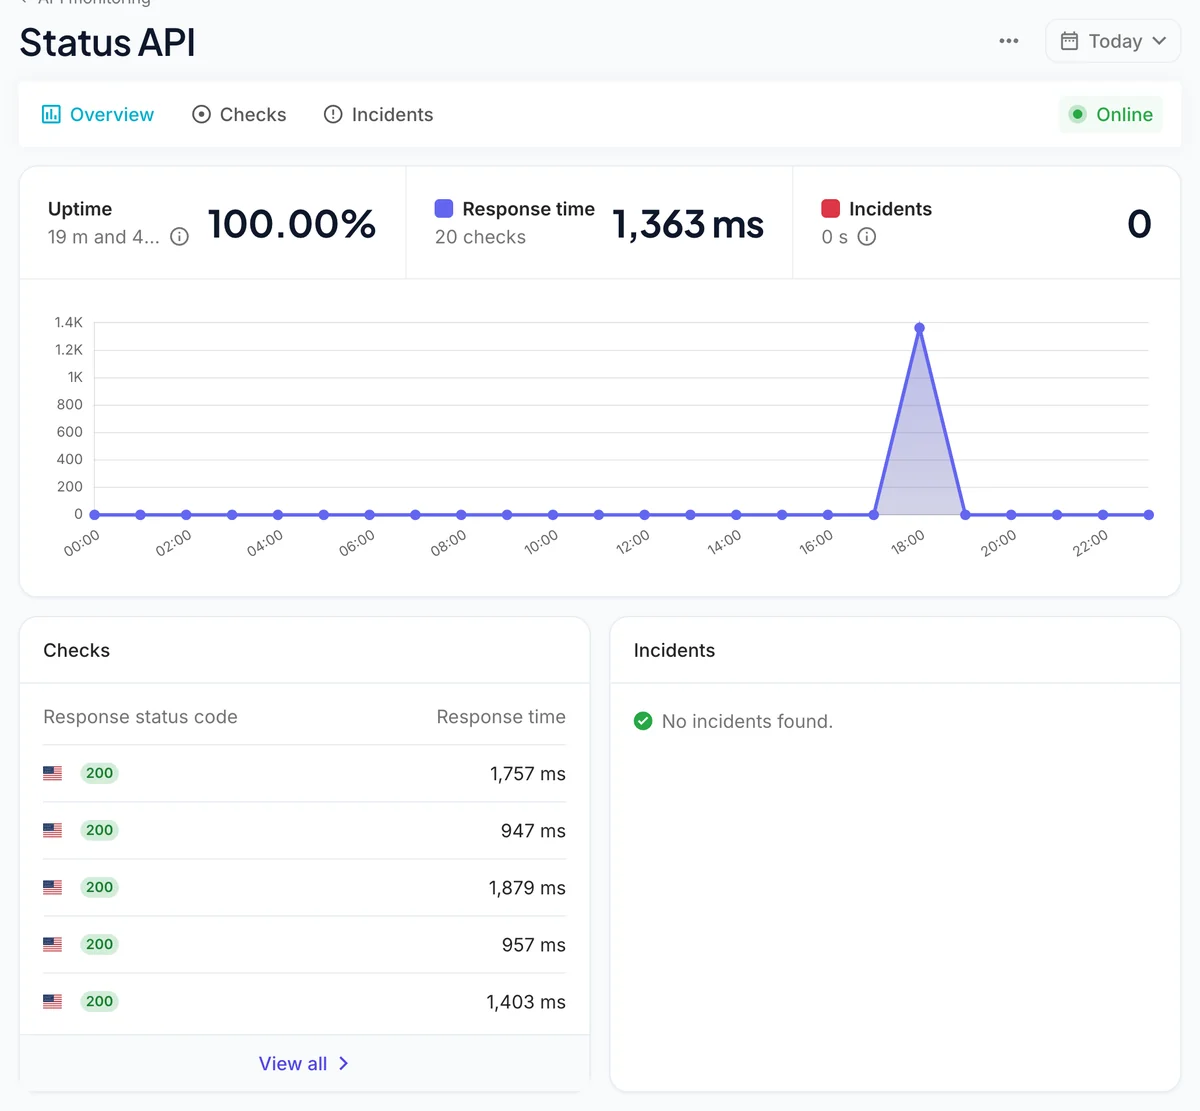 Response times and status codes per check.
4. Point your status page and cancel
Move any public status page across, confirm a full week of clean overlap, then cancel BlazeMeter API Monitoring. Keep the export from step 1 — it is the easiest way to prove nothing was left behind.
How this comparison was put together
This page is written by the team that builds MonitoringDaddy, so treat it as an informed argument rather than a neutral audit. What we can promise is that the claims about our own product are checked against what the software actually does, and the rows where BlazeMeter API Monitoring is stronger are marked as such rather than quietly omitted.
Details about BlazeMeter API Monitoring come from their public pricing and documentation at the time of writing. Monitoring vendors change plan limits and prices frequently and without announcement, so every third-party figure here carries a "verify on their site" caveat and you should take it seriously before making a decision on cost.
One thing worth stating plainly, because most comparison pages fudge it: MonitoringDaddy checks run from our own infrastructure, which is external to yours, but from a single origin rather than a global probe network. That is enough to catch outages and content changes independently of your stack. It is not enough to tell you a site is down in Frankfurt but up in Ohio. If regional verification is a hard requirement, a larger platform will serve you better and we would rather you knew that now.
Found something out of date or wrong? Tell us and we will correct it.
What an alert actually looks like
Every recorded change is compared word by word and kept with a before-and-after image. This is the real output, shown with worked example data.
Price fell from $49 to $39, and an annual discount was added.
The item is available again and the basket button returned.
A new subprocessor was added in another jurisdiction.
Where we can reach you
The free plan sends to one email address. Every paid plan adds the chat and webhook channels below, with 2 to 10 destinations depending on the plan. However many alerts you receive, the price does not change — nothing here is metered or charged per alert.
There are no voice calls and no SMS. If a phone call at 3am is a hard requirement, say so before you subscribe — we would rather tell you now than refund you later.
BlazeMeter API Monitoring alternative: your questions answered
Is this the same as Runscope?
BlazeMeter API Monitoring is the continuation of Runscope under Perforce. If you are searching for Runscope, that is where it went.
Can you chain API requests?
No. Each check is a single request. Chained workflows are exactly what BlazeMeter does and we do not.
Do you load test?
No, none. We check availability on a schedule.
What do you add?
Certificate and domain expiry, page-change detection with images, cron heartbeats and status pages.
Do you check from several regions?
No, one origin.
Who should switch?
Teams monitoring a few endpoints who do not need testing infrastructure around them.
Compare other monitoring tools
- CertPost alternativeHow MonitoringDaddy compares with CertPost
- updown.io alternativeHow MonitoringDaddy compares with updown.io
- HetrixTools alternativeHow MonitoringDaddy compares with HetrixTools
- Host-Tracker alternativeHow MonitoringDaddy compares with Host-Tracker
- Pulsetic alternativeHow MonitoringDaddy compares with Pulsetic
- MonSpark alternativeHow MonitoringDaddy compares with MonSpark
- UptimeRobot alternativeHow MonitoringDaddy compares with UptimeRobot
- Pingdom alternativeHow MonitoringDaddy compares with Pingdom
- StatusCake alternativeHow MonitoringDaddy compares with StatusCake
- Better Stack alternativeHow MonitoringDaddy compares with Better Stack
- Uptime Kuma alternativeHow MonitoringDaddy compares with Uptime Kuma
- Visualping alternativeHow MonitoringDaddy compares with Visualping
- Distill.io alternativeHow MonitoringDaddy compares with Distill.io
- ChangeTower alternativeHow MonitoringDaddy compares with ChangeTower
- changedetection.io alternativeHow MonitoringDaddy compares with changedetection.io
- Hexowatch alternativeHow MonitoringDaddy compares with Hexowatch
- Wachete alternativeHow MonitoringDaddy compares with Wachete
- Versionista alternativeHow MonitoringDaddy compares with Versionista
- Fluxguard alternativeHow MonitoringDaddy compares with Fluxguard
- PageCrawl.io alternativeHow MonitoringDaddy compares with PageCrawl.io
- Sken.io alternativeHow MonitoringDaddy compares with Sken.io
- Freshping alternativeHow MonitoringDaddy compares with Freshping
- Site24x7 alternativeHow MonitoringDaddy compares with Site24x7
- Hyperping alternativeHow MonitoringDaddy compares with Hyperping
- Cronitor alternativeHow MonitoringDaddy compares with Cronitor
- Healthchecks.io alternativeHow MonitoringDaddy compares with Healthchecks.io
- Dead Man's Snitch alternativeHow MonitoringDaddy compares with Dead Man's Snitch
- Cronhub alternativeHow MonitoringDaddy compares with Cronhub
- Sentry Crons alternativeHow MonitoringDaddy compares with Sentry Crons
- Oh Dear alternativeHow MonitoringDaddy compares with Oh Dear
- Uptime.com alternativeHow MonitoringDaddy compares with Uptime.com
- TrackSSL alternativeHow MonitoringDaddy compares with TrackSSL
- KeyChest alternativeHow MonitoringDaddy compares with KeyChest
- SSLMate Cert Spotter alternativeHow MonitoringDaddy compares with SSLMate Cert Spotter
- Atlassian Statuspage alternativeHow MonitoringDaddy compares with Atlassian Statuspage
- Instatus alternativeHow MonitoringDaddy compares with Instatus
- DomainMOD alternativeHow MonitoringDaddy compares with DomainMOD
- Uptrends alternativeHow MonitoringDaddy compares with Uptrends
- Checkly alternativeHow MonitoringDaddy compares with Checkly
- Postman Monitors alternativeHow MonitoringDaddy compares with Postman Monitors
- Qualys SSL Labs alternativeHow MonitoringDaddy compares with Qualys SSL Labs
- Venafi alternativeHow MonitoringDaddy compares with Venafi
- Keyfactor alternativeHow MonitoringDaddy compares with Keyfactor
- DigiCert CertCentral alternativeHow MonitoringDaddy compares with DigiCert CertCentral
- Red Sift Certificates alternativeHow MonitoringDaddy compares with Red Sift Certificates
- Sematext Synthetics alternativeHow MonitoringDaddy compares with Sematext Synthetics
- Datadog alternativeHow MonitoringDaddy compares with Datadog
- Status.io alternativeHow MonitoringDaddy compares with Status.io
- Freshstatus alternativeHow MonitoringDaddy compares with Freshstatus
- Statuspal alternativeHow MonitoringDaddy compares with Statuspal
- Cachet alternativeHow MonitoringDaddy compares with Cachet
- Upptime alternativeHow MonitoringDaddy compares with Upptime
- Hund alternativeHow MonitoringDaddy compares with Hund
- StatusGator alternativeHow MonitoringDaddy compares with StatusGator
- Sorry alternativeHow MonitoringDaddy compares with Sorry
- Dotcom-Monitor alternativeHow MonitoringDaddy compares with Dotcom-Monitor
- DomainTools alternativeHow MonitoringDaddy compares with DomainTools
- WhoisXML API alternativeHow MonitoringDaddy compares with WhoisXML API
- Domsignal alternativeHow MonitoringDaddy compares with Domsignal
- Assertible alternativeHow MonitoringDaddy compares with Assertible
- APIContext alternativeHow MonitoringDaddy compares with APIContext
- New Relic Synthetics alternativeHow MonitoringDaddy compares with New Relic Synthetics
- Treblle alternativeHow MonitoringDaddy compares with Treblle
- Moesif alternativeHow MonitoringDaddy compares with Moesif
- Testfully alternativeHow MonitoringDaddy compares with Testfully
- RapidAPI Testing alternativeHow MonitoringDaddy compares with RapidAPI Testing
- Nagios alternativeHow MonitoringDaddy compares with Nagios
- Zabbix alternativeHow MonitoringDaddy compares with Zabbix
- Prometheus Pushgateway alternativeHow MonitoringDaddy compares with Prometheus Pushgateway
- DNSSpy alternativeHow MonitoringDaddy compares with DNSSpy
- Hexometer alternativeHow MonitoringDaddy compares with Hexometer
- Website change detectionGet alerted the moment a page changes
- Complete setup guideEvery monitor type, start to finish
- Hosted status pagesTell customers before they ask
Last updated August 4, 2026 · Written by Amit Gupta, founder of MonitoringDaddy
Try it before you cancel anything.
Set up a monitor on your most important URL and run it alongside BlazeMeter API Monitoring for a week. Plans from $5 a month, cancel any time.