Know when your API stops answering properly
An API can be up and still be broken. It can return 200 with an empty list, 200 with an error wrapped in JSON, or 200 from a cached edge while the origin is down. Checking that the port answers tells you almost nothing — what matters is whether the response still says what it is supposed to say.
From $5 a month · No check quotas · Set up in under a minute
What is API monitoring?
A request made to one of your endpoints on a schedule, using the method, headers and credentials a real client would use, with a rule about what a healthy response looks like. If the endpoint stops answering, or answers with something it should not, you get an alert — email, Slack, Teams, Discord, Telegram or webhook. Nothing is installed and the API does not need to know it is being watched.
Most API outages are not the dramatic kind. The service answers, the load balancer is happy, the dashboard is green — and a downstream dependency has quietly started returning an empty array. Anything watching only for a connection failure sees nothing wrong, because nothing failed in the way it was looking for.
That is the gap this closes. A check that sends the request a real client sends, with the same authentication, and then reads the response rather than just counting it, catches the failures that a port check never will: an expired token, a broken deploy that still boots, a dependency returning nulls, a rate limit that has started biting.
It is also the cheapest monitoring you will set up, because the endpoint already exists. Most teams point the first check at the health endpoint they wrote and forgot about.
The failures a status code will not show you
Every one of these returns 200. None of them are healthy.
The endpoint that answers with an error
Plenty of APIs return 200 with {"error": "..."} in the body, because the HTTP layer worked even though the request did not. A check that only reads the status code records a success, and the first person to notice is a customer whose integration has been silently failing.
The empty result that used to have data
A search endpoint returning an empty array is indistinguishable from a working one unless something knows what the response should contain. This is the classic broken-dependency signature: the API is fine, the thing behind it is not.
The token that expired at the weekend
API keys and certificates expire on a date nobody has in their calendar. The endpoint starts returning 401 and keeps doing so until somebody notices, which on a quiet integration can be weeks.
The cached response hiding a dead origin
A CDN or reverse proxy will happily keep serving the last good response after the origin has stopped answering. Checking from outside your network is the only way to see what a client actually receives.
The request, the credentials, and the rule
Three things to set, and only the last one takes any thought.
The request
Choose the method the endpoint expects — GET, POST, HEAD, PUT, DELETE, PATCH or OPTIONS — and give it the address. For most health and read endpoints a plain GET is exactly what a client would send.
The credentials
Add whatever headers the endpoint needs, so the check is authenticated the way a client is: Authorization: Bearer …, X-API-Key: …, a version header, anything else it expects. HTTP basic auth has its own username and password fields rather than needing a hand-built header.
The rule for a healthy response
This is the setting worth thinking about. As well as alerting when the endpoint becomes unavailable, you can require that the response contains a particular piece of text, or that it never contains one. Requiring "status":"ok" catches the wrapped-error case; forbidding "error" catches it from the other direction.
What happens when it fails
The endpoint is checked again before anything is sent, so a single dropped packet does not page anyone. If it fails twice an incident opens and your alert channels fire; when it answers correctly again the incident closes and you are told it recovered.
Set up an API monitor, step by step
API monitors have their own list under Monitors → API, and the request settings sit one click away on the form.
1. Open Monitors → API → New API monitor
Name the monitor after the endpoint ("Orders API health") and enter its full URL.
2. Check the body, not just the status
Many APIs return 200 with an error inside the JSON. Set Alert condition to URL response does not contain text and enter something only a healthy response contains, such as "status":"ok".
3. Set the method, headers and credentials
Click Request to open the request settings. Choose the method — GET, POST, HEAD, PUT, DELETE, PATCH or OPTIONS — and add headers such as Authorization or Accept. HTTP basic authentication has its own username and password fields. Turn on Cache buster if a cache in front of the API might answer instead of the API itself. There is no request-body field, so use a GET health endpoint rather than a POST that needs a payload.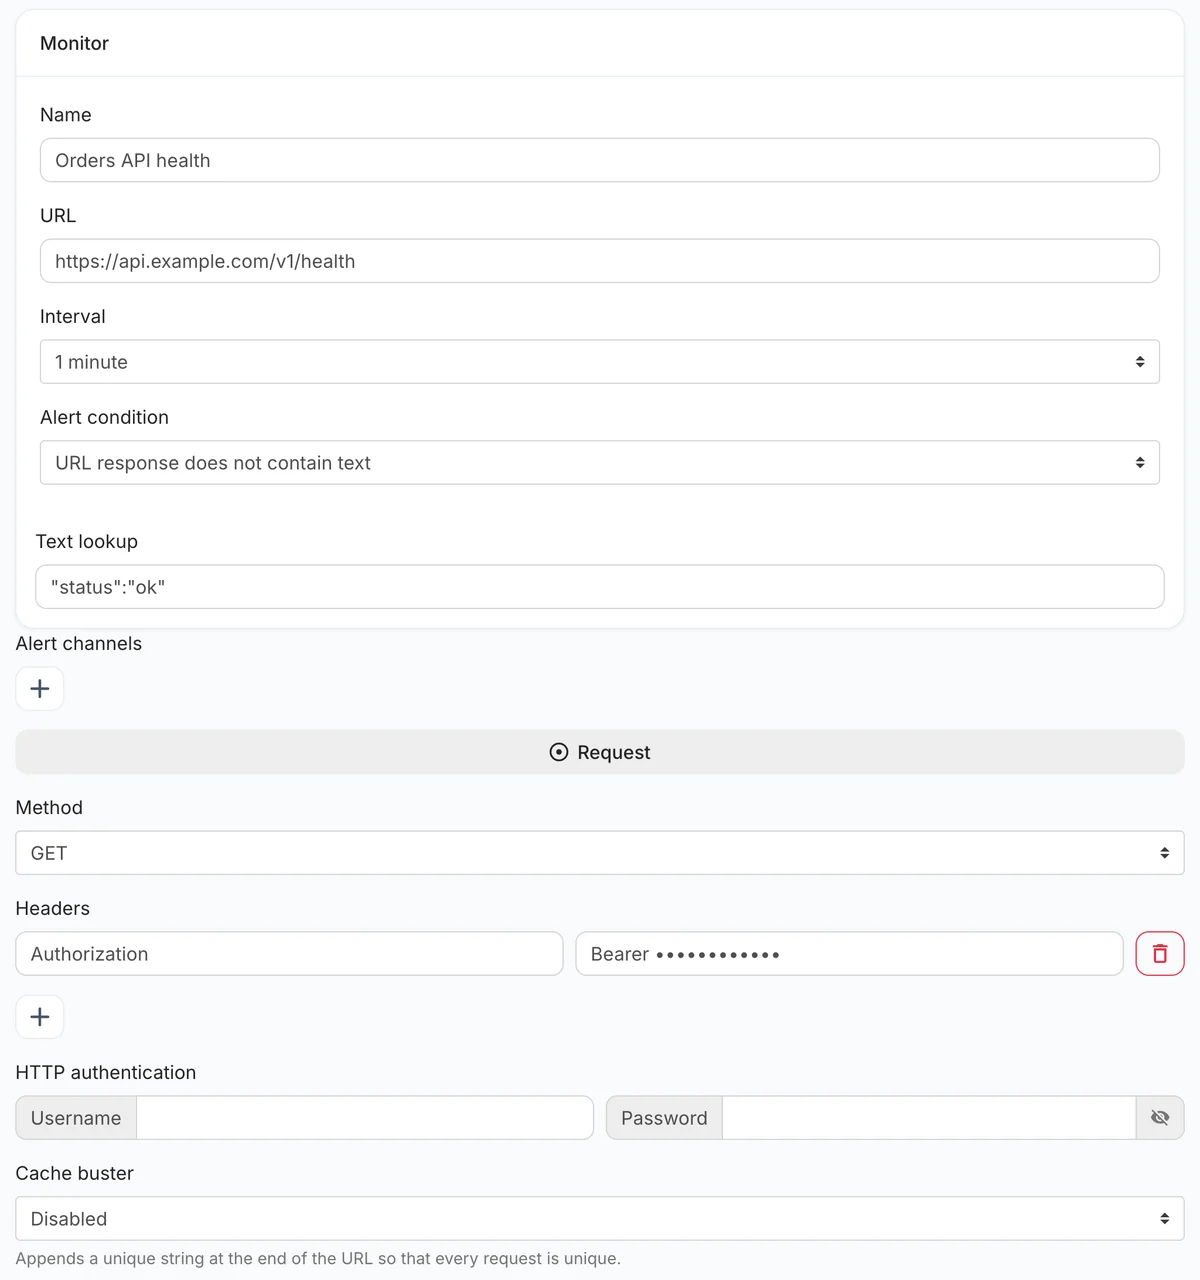 A text check on the response, plus method, headers and authentication.
4. Save and watch the response times
The overview charts response time and lists each check with its status code, which is where a slow dependency shows up long before it fails.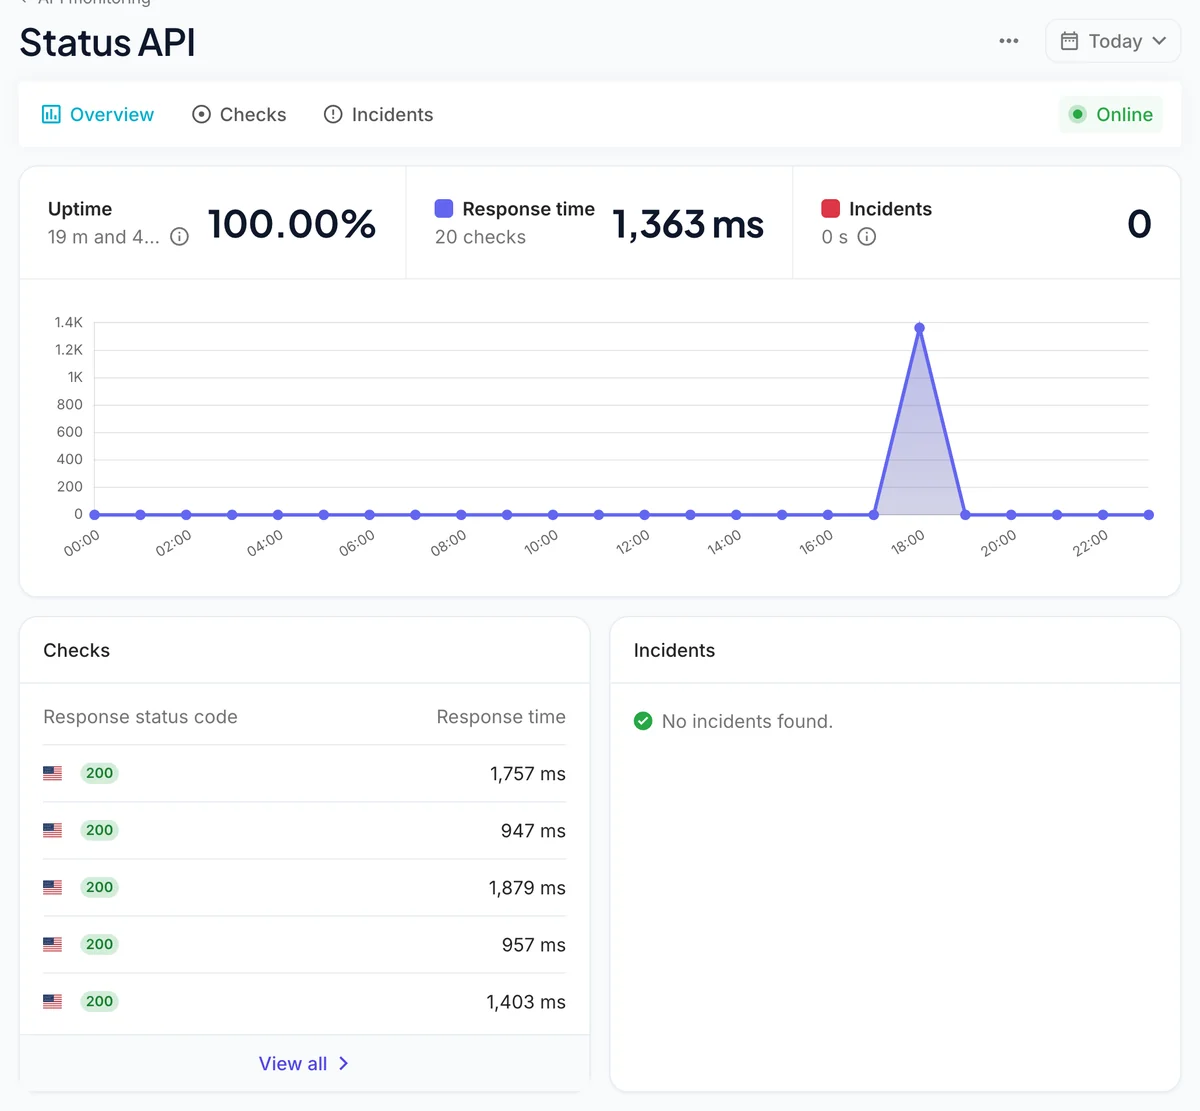 Response times and status codes for every check.
Choosing what to check
The endpoint you pick decides how much the check is worth.
Prefer an endpoint that touches something real
A health endpoint returning a hard-coded {"ok":true} proves the process is running and nothing else. One that reads from the database, or names the version it is running, tells you something you could not have guessed. It is the difference between "the server booted" and "the service works".
Assert on something that would change if it broke
Pick a phrase that is present when the endpoint is healthy and absent when it is not. A version string, a status field, a known record. Matching on something that appears in the error page too will make the check permanently green.
Use a read-only endpoint
Every check is a real request. Point it at something that reads rather than writes, or you will be creating a row every minute for as long as the monitor exists.
Watch the certificate as well
An API served over HTTPS has a certificate that expires, and an expired certificate takes the endpoint down for every client that verifies it. The same monitor can warn you ahead of the expiry date.
How to monitor an API endpoint
Add an endpoint, authenticate the check, and decide what a healthy response looks like.
Add the endpoint
Paste the full URL of the endpoint you want watched and give the monitor a name you will recognise in an alert.
Set the method and headers
Choose the HTTP method the endpoint expects and add any headers it needs, such as an Authorization or API key header.
Say what healthy looks like
Alert when the endpoint becomes unavailable, or when the response stops containing an expected phrase such as "status":"ok".
Choose how often to check
From every minute upwards, depending on your plan and how quickly you would want to know.
Pick where alerts go
Email, Slack, Microsoft Teams, Discord, Telegram, Flock, a webhook, or browser push.
Typically about 5 minutes from start to finish.
What it costs
Uptime monitors, watched pages and heartbeats each get their own allowance, so adding a page watch never costs you a monitor. SSL and domain checks ride along with the monitor they belong to and use nothing extra.
| Plan | Monitors | Watched pages | Heartbeats | Fastest interval | Alert channels | Price |
|---|---|---|---|---|---|---|
| Starter | 25 | 25 | 25 | Every 5 minutes | Email + webhook & chat | $5/mo |
| Basic | 10 | 10 | 10 | Every 10 minutes | Email + webhook & chat | $8/mo |
| Growth | 50 | 50 | 50 | Every 5 minutes | Email + webhook & chat | $19/mo |
| Pro | 100 | 100 | 100 | Every 60 seconds | Email + webhook & chat | $34/mo |
Annual billing is cheaper on every paid tier. The pricing page is the authoritative list.
What an alert actually looks like
Every recorded change is compared word by word and kept with a before-and-after image. This is the real output, shown with worked example data.
Price fell from $49 to $39, and an annual discount was added.
The item is available again and the basket button returned.
A new subprocessor was added in another jurisdiction.
Where we can reach you
The free plan sends to one email address. Every paid plan adds the chat and webhook channels below, with 2 to 10 destinations depending on the plan. However many alerts you receive, the price does not change — nothing here is metered or charged per alert.
There are no voice calls and no SMS. If a phone call at 3am is a hard requirement, say so before you subscribe — we would rather tell you now than refund you later.
API monitoring questions
What is the difference between API monitoring and uptime monitoring?
Only the rule you apply to the response. Both make a scheduled request from outside your network; an uptime check usually asks whether a page answered, while an API check also asks whether the answer was correct. The same monitor does both — you are choosing how strict to be.
Can it send authenticated requests?
Yes. Add any headers the endpoint expects, which covers bearer tokens, API keys and version headers, and there are separate fields for HTTP basic auth so you do not have to encode it yourself. The check is then made exactly as an authenticated client would make it.
Can it send a request body, for example a POST payload?
No. You can choose any method including POST, but the request is sent without a body, so an endpoint that requires a JSON payload cannot be checked properly. If that is what you need, point the monitor at a read-only endpoint that depends on the same code path instead — it will fail for the same reasons.
Can it check a value inside the JSON, like a field being above a number?
Not as structured data. The check looks for text being present or absent in the response, which handles the common cases — a status field, a version string, the absence of the word "error" — but it does not parse JSON or evaluate expressions against it. Anything that needs real assertions on parsed values wants a dedicated API testing tool.
How often can an endpoint be checked?
From every minute on paid plans, and every five minutes on the free one. Faster is not always better: a check every minute against an endpoint that touches a database is 43,200 requests a month, which is worth being deliberate about.
Does it monitor the SSL certificate too?
Yes, on the same monitor. You can be warned a set number of days before the certificate expires, which matters more for APIs than for websites — clients verifying a certificate fail hard and immediately, with no user to click through a warning.
What happens if my API is behind a firewall or a VPN?
Then a hosted checker cannot reach it, and no hosted checker can. The check is made from our servers over the public internet, so the endpoint has to be reachable from there. An internal service is better watched by something running inside the same network, or by a heartbeat it calls out to.
Will it tell me why the endpoint failed?
It records the status code, the response time and the reason the check failed, and the incident keeps that alongside when it started and when it recovered. What it cannot do is explain the cause inside your application — it is looking at your API the way a client does, from outside.
Does a failed check retry before alerting?
Yes. Anything that looks like a failure is checked again after a short delay, and only alerts if it fails the second time. A single timed-out request on a busy network is not worth waking anyone for.
Can I put an API endpoint on a status page?
Yes. Any monitor can be published to a hosted status page, with its own domain if you want one, so customers integrating with your API can see its state without emailing you to ask.
Is response time recorded?
Every check records how long the request took, and the history is kept for as long as your plan retains data, so you can see an endpoint getting slower before it starts failing.
How many API checks do I get?
They use the same allowance as uptime monitors: one on the free plan, and up to a hundred on Pro. Page watches and heartbeats are counted separately, so an API check never costs you one of those.
Related monitoring guides
- Website uptime monitoringThe same check, less strict about the answer
- Cron job monitoringFor work that runs on a schedule
- SSL expiry monitoringCertificates that take an API down when they lapse
Last updated August 4, 2026 · Written by Amit Gupta, founder of MonitoringDaddy
Find out before your customers integrate with a broken endpoint.
The free plan includes a monitor, needs no card, and takes about a minute to point at an endpoint you already have.